I’m always looking for ways to spark my kid’s interest in computers, data, etc. This has proven to be more difficult than I thought it would be (kids these days…). I suspect this may have something to do with the ubiquity of electronic devices that “just work”, making them less novel and less interesting to tinker with, but speculation on this is a post for another time…
Anyway, all of my kids are into Pokemon so when I came across some Pokemon data the other day that leant itself very nicely to a Trelliscope display, I thought I might have a chance to engage them. And then I thought why not write a post about it. You can find the resulting display and code to recreate it in this post. Hope you enjoy!
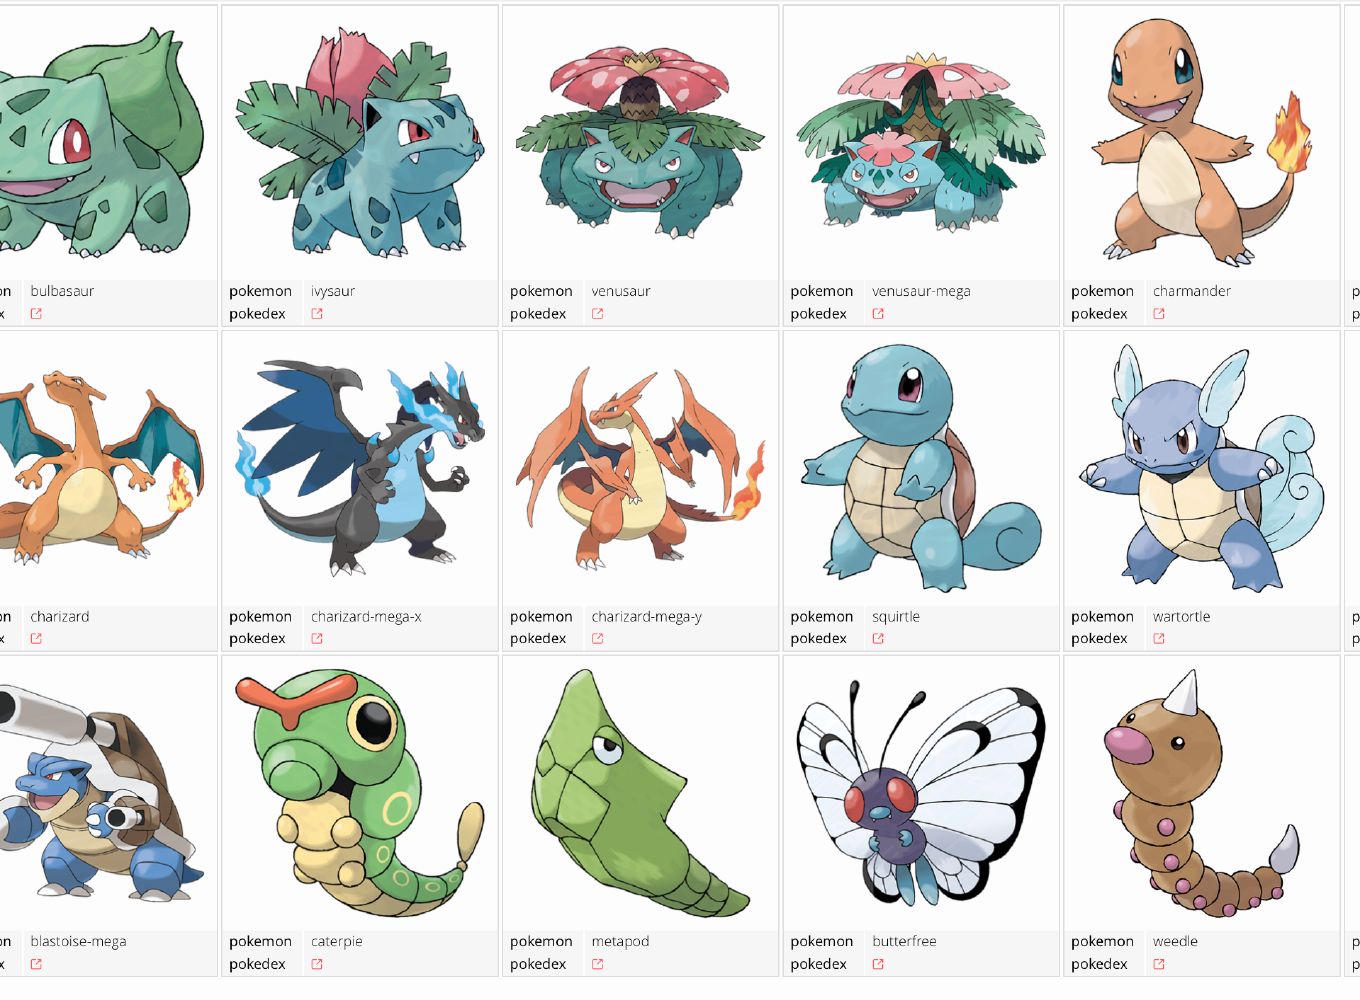
To start out, here’s the display:
If this display doesn’t appear correctly for you (because of blog aggregators, etc.), you can follow this link to the display in a dedicated window. For better viewing, you can also click the bottom right “fullscreen” button to expand the display to fill the window.
The data from which this was created is a simple data frame of Pokemon statistics, based on this source (which borrows from here). I slightly modified the data to add some variables that enhance the display (I changed the image URL to a better source, added a variable “pokedex” that provides a link to the pokemon’s pokedex entry on pokemon.com, and removed a few special Pokemon that I couldn’t find on pokedex).
Since this data is simply a data frame where each row refers to a Pokemon, it lends itself nicely to a Trelliscope display showing an image of the Pokemon as the panel and allowing interaction with the Pokemon being viewed based on the various statistics provided.
Here’s the code to make the display. Once the data is read, it’s just a few lines.
# install packages if not installed
devtools::install_github("hafen/trelliscopejs")
install.packages(c("readr", "dplyr"))

library(readr)
library(dplyr)
library(trelliscopejs)

# read the data (making "_id" columns strings)
pok <-
  read_csv("https://raw.githubusercontent.com/hafen/pokRdex/master/pokRdex_mod.csv") %>%
  mutate_at(vars(matches("_id$")), as.character)

# take a look
glimpse(pok)
Observations: 801
Variables: 30
$ pokemon                 <chr> "bulbasaur", "ivysaur", "venusaur", "ve...
$ id                      <int> 1, 2, 3, 4, 5, 6, 7, 8, 9, 10, 11, 12, ...
$ species_id              <chr> "1", "2", "3", "3", "4", "5", "6", "6",...
$ height                  <int> 7, 10, 20, 24, 6, 11, 17, 17, 17, 5, 10...
$ weight                  <int> 69, 130, 1000, 1555, 85, 190, 905, 1105...
$ base_experience         <int> 64, 142, 236, 281, 62, 142, 240, 285, 2...
$ type_1                  <chr> "grass", "grass", "grass", "grass", "fi...
$ type_2                  <chr> "poison", "poison", "poison", "poison",...
$ attack                  <int> 49, 62, 82, 100, 52, 64, 84, 130, 104, ...
$ defense                 <int> 49, 63, 83, 123, 43, 58, 78, 111, 78, 6...
$ hp                      <int> 45, 60, 80, 80, 39, 58, 78, 78, 78, 44,...
$ special_attack          <int> 65, 80, 100, 122, 60, 80, 109, 130, 159...
$ special_defense         <int> 65, 80, 100, 120, 50, 65, 85, 85, 115, ...
$ speed                   <int> 45, 60, 80, 80, 65, 80, 100, 100, 100, ...
$ ability_1               <chr> "overgrow", "overgrow", "overgrow", "th...
$ ability_2               <chr> NA, NA, NA, NA, NA, NA, NA, NA, NA, NA,...
$ ability_hidden          <chr> "chlorophyll", "chlorophyll", "chloroph...
$ color_1                 <chr> "#78C850", "#78C850", "#78C850", "#78C8...
$ color_2                 <chr> "#A040A0", "#A040A0", "#A040A0", "#A040...
$ color_f                 <chr> "#81A763", "#81A763", "#81A763", "#81A7...
$ egg_group_1             <chr> "monster", "monster", "monster", "monst...
$ egg_group_2             <chr> "plant", "plant", "plant", "plant", "dr...
$ url_image               <chr> "http://assets.pokemon.com/assets/cms2/...
$ generation_id           <chr> "1", "1", "1", NA, "1", "1", "1", NA, N...
$ evolves_from_species_id <chr> NA, "1", "2", NA, NA, "4", "5", NA, NA,...
$ evolution_chain_id      <chr> "1", "1", "1", NA, "2", "2", "2", NA, N...
$ shape_id                <chr> "8", "8", "8", NA, "6", "6", "6", NA, N...
$ shape                   <chr> "quadruped", "quadruped", "quadruped", ...
$ pokebase                <chr> "bulbasaur", "ivysaur", "venusaur", "ve...
$ pokedex                 <chr> "http://www.pokemon.com/us/pokedex/bulb...
Now we can create a Trelliscope display by specifying url_image as the source for the panel images. We also specify a default state indicating that the values for the variables pokemon and pokedex should be shown as labels by default.
pok %>%
  mutate(panel = img_panel(url_image)) %>%
  trelliscope("pokemon", nrow = 3, ncol = 6,
    state = list(labels = c("pokemon", "pokedex")))
This will produce the interactive plot shown at the top of this post. You can use the display to find Pokemon based on sorting or filtering on several of their attributes.
Note that despite my kids constantly telling me about and showing me their Pokemon cards, I am not a Pokemon expert, so there may be some interesting things I am missing. But I can say that my kids were finally impressed and engaged with something that I showed them. Success!
If this is your first exposure to Trelliscope and you are interested in other things it can do, please see my original blog post.
This is my last post of the year. Happy new year!